Monthly Budget Tracker for Google Sheets walkthrough
This is Jacob from Etsy, and I’m here to guide you through our Monthly Budget Tracker for Google Sheets. We have created this budget tracker to help you organize and improve your finances because we know organizing and keeping track of your finances can be overwhelming. This budget tracker makes it easy to get your […]
This is Jacob from Etsy, and I’m here to guide you through our Monthly Budget Tracker for Google Sheets.
We have created this budget tracker to help you organize and improve your finances because we know organizing and keeping track of your finances can be overwhelming. This budget tracker makes it easy to get your finances in order. It’s easy to use and easy to set up and in this tutorial I’m going to show you how.
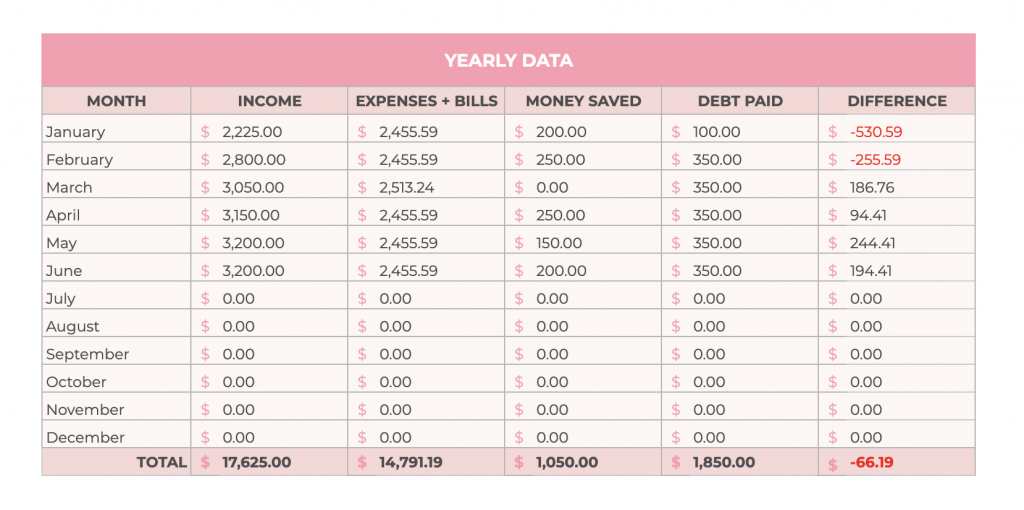
When you open the Monthly Budget Tracker, you’ll see the yearly dashboard. This dashboard shows you a summary and overview of your financial data throughout the year.
For example, on the top right of the dashboard you can see a table that tracks your income and you expenses for each month of the year. This is all automated so you don’t have to edit anything here. The data will appear once you edit your monthly budget sheets.
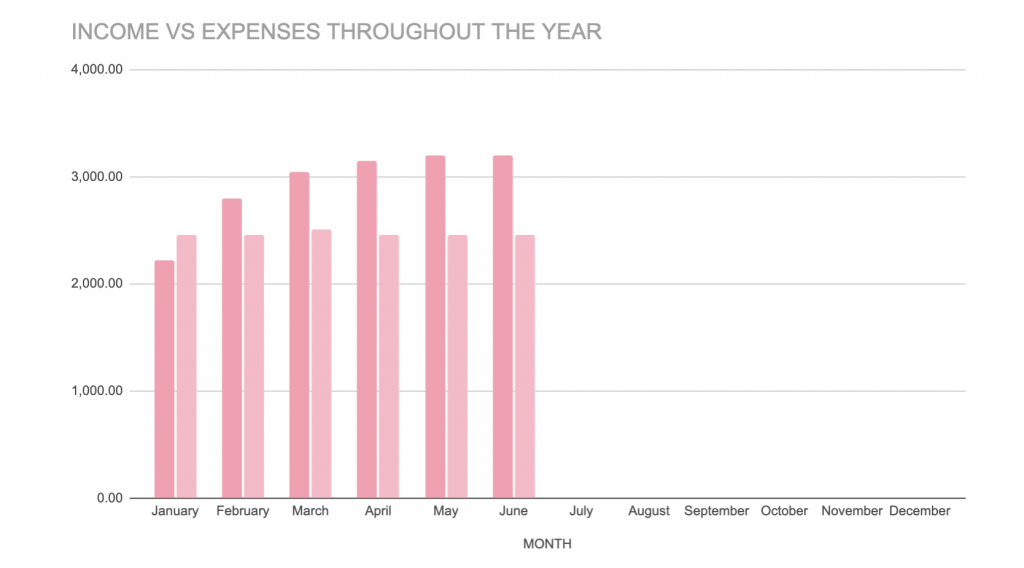
On the bottom of the dashboard you’ll see two graphs. The left graph tracks your income vs. expenses so you can see for each month of the year the difference between your incomes and expenses.
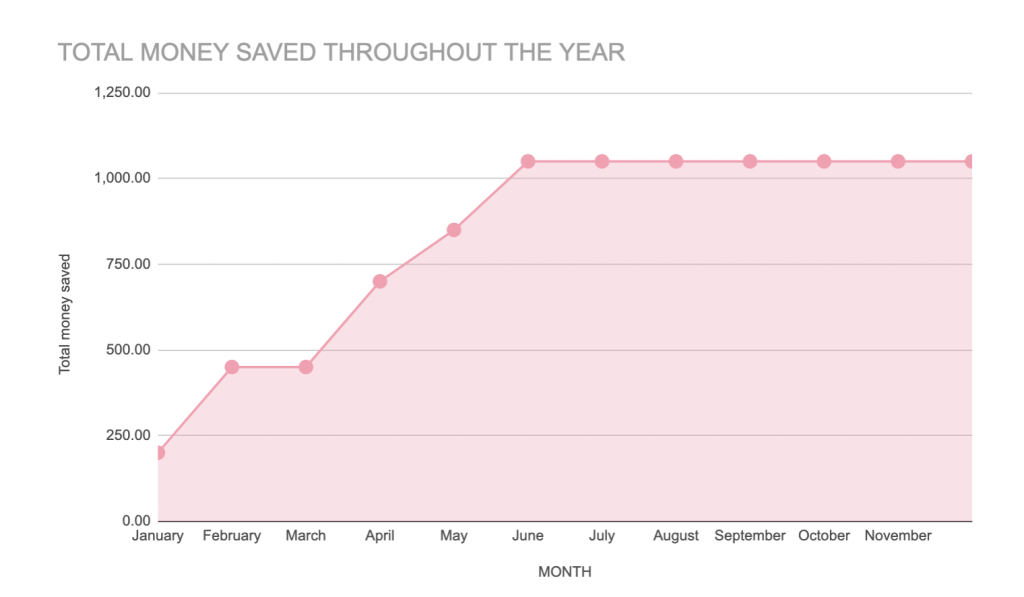
The right graph tracks the amounts of money that you have saved for each month of the year.
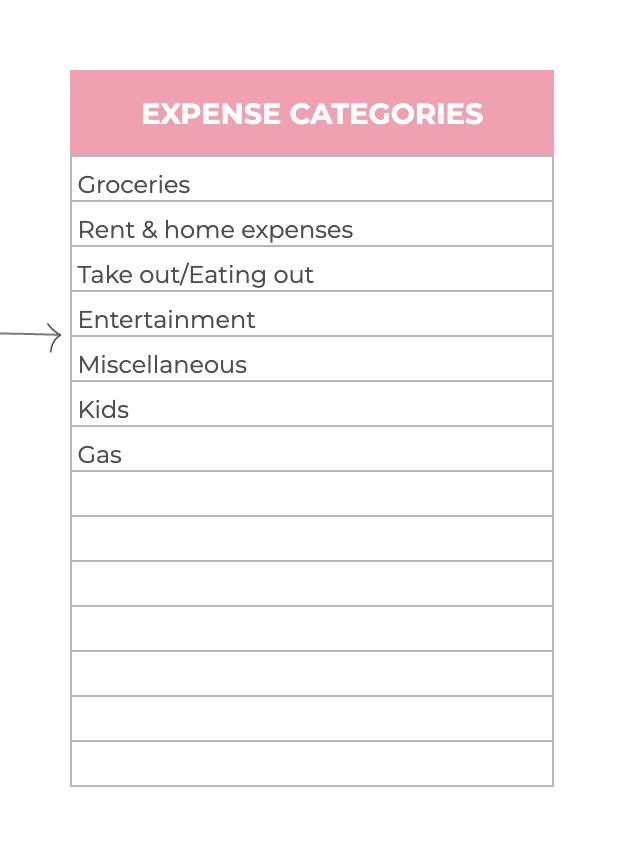
There’s one thing that you have to manually set up in the yearly dashboard and that are your expense categories. The expense categories are used to categorize your expenses for the expense trackers in the monthly budget sheets.
Besides this yearly dashboard, there are twelve more sheets included in this budget tracker which you can see at the bottom. There are twelve tabs for each month for you to navigate to the month that you want to track.

Let’s go to the month of June to show you an example.
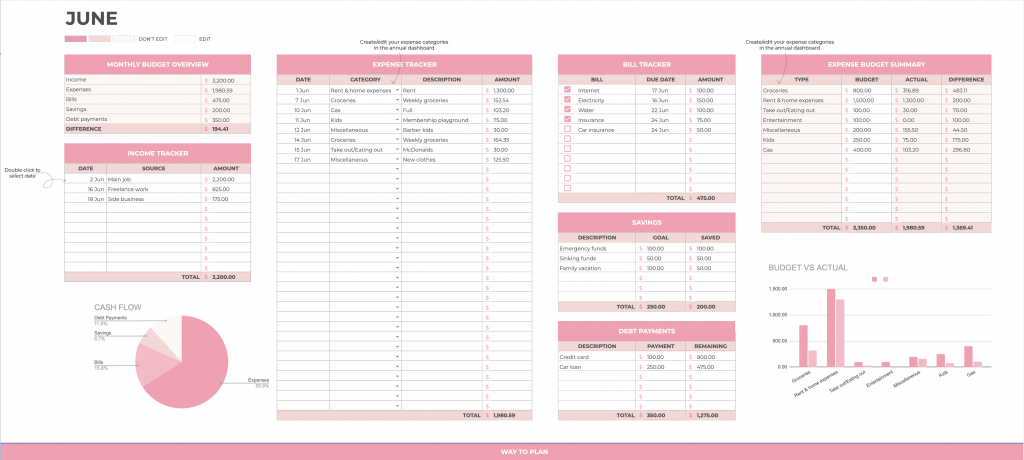
Here you can see all of your finances at a glance. As you can see there are several sections included in this monthly sheet and I will guide you through each one of them.
When you look at the tracker, you’ll see white cells and colored cells. You can only edit the white cells. When a cell is colored it means that the data displayed therein are automatically generated from the data you have put in the white cells.
The first section is the monthly budget overview.
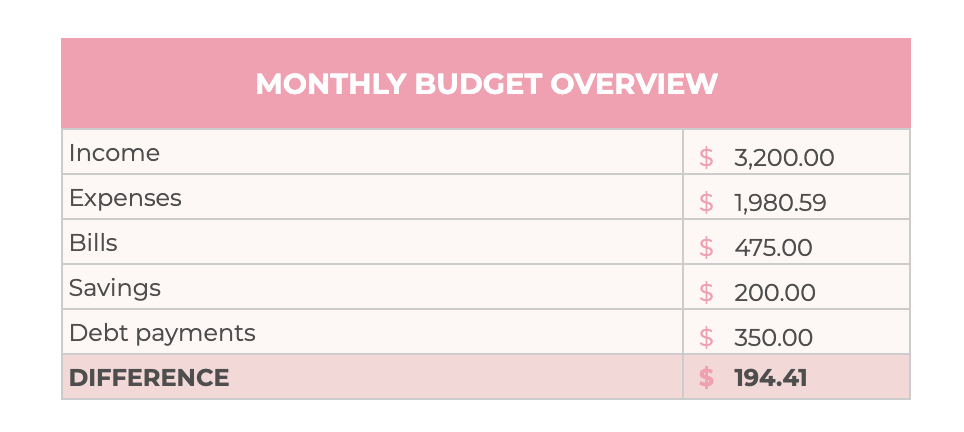
This is a quick summary of your income, expenses, bills, and debt payments for the current month. These data will automatically be updated (the cells are colored) once you edit the other sections in the tracker.
The next section is the income tracker.
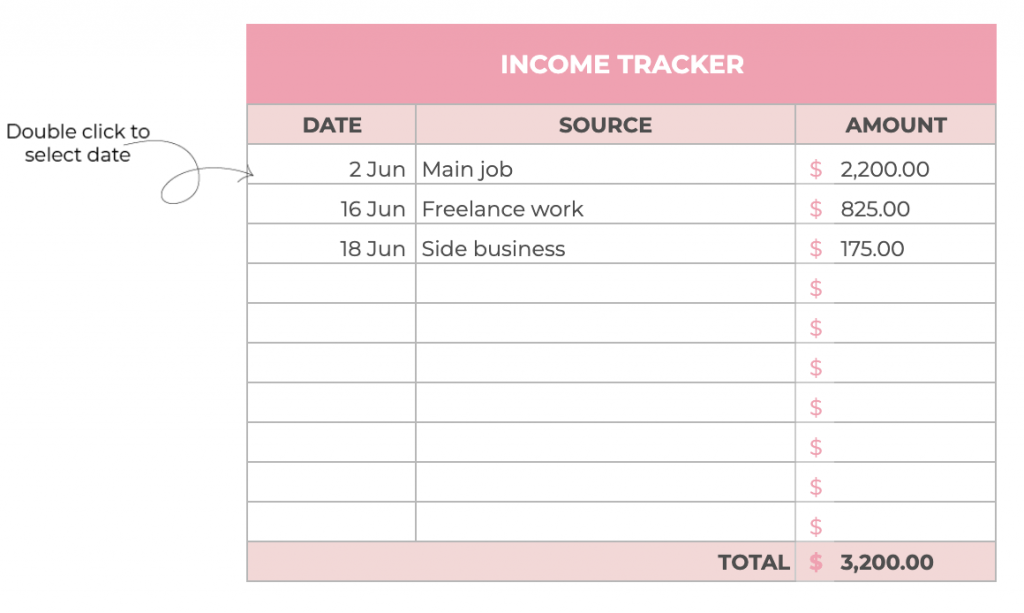
Here you can fill in the amount(s) of money you have made throughout the month. You can add several income sources in this tracker. When you want to add an income source, you first have to select a date. In order to do that you have to double click on the white cell to see the date picker. From there you can select the date. The cell next to it is where you can specify your income source. The last cell in the row you can add the amount that you have made. On the bottom you can see the amounts totaled up.
Next, we have the cash flow diagram at the bottom.
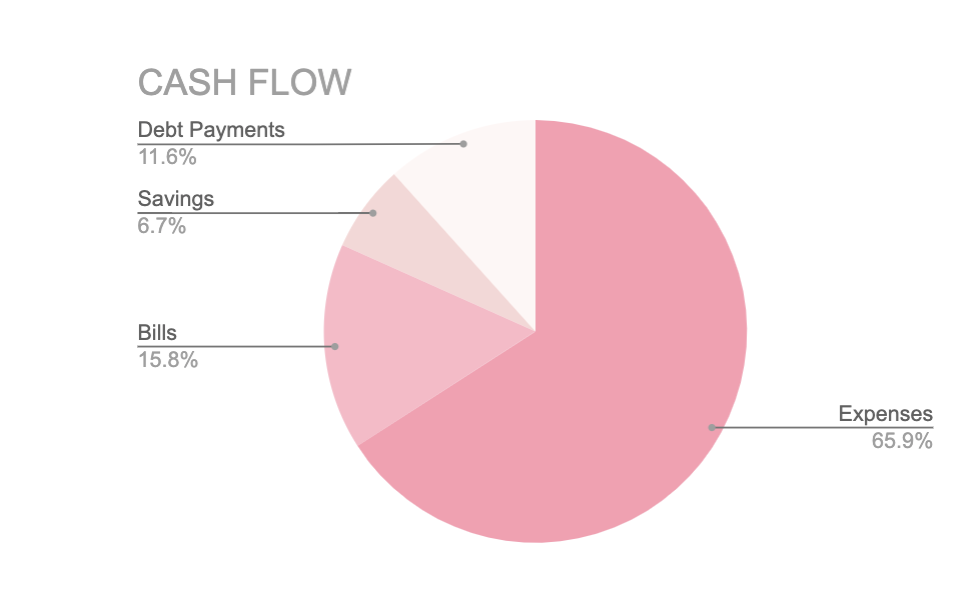
Here you can see how you have spent your money at a glance. You can see how much of your momey went to your expenses, bills, savings, and debt payments.
Then, we have the expense tracker.
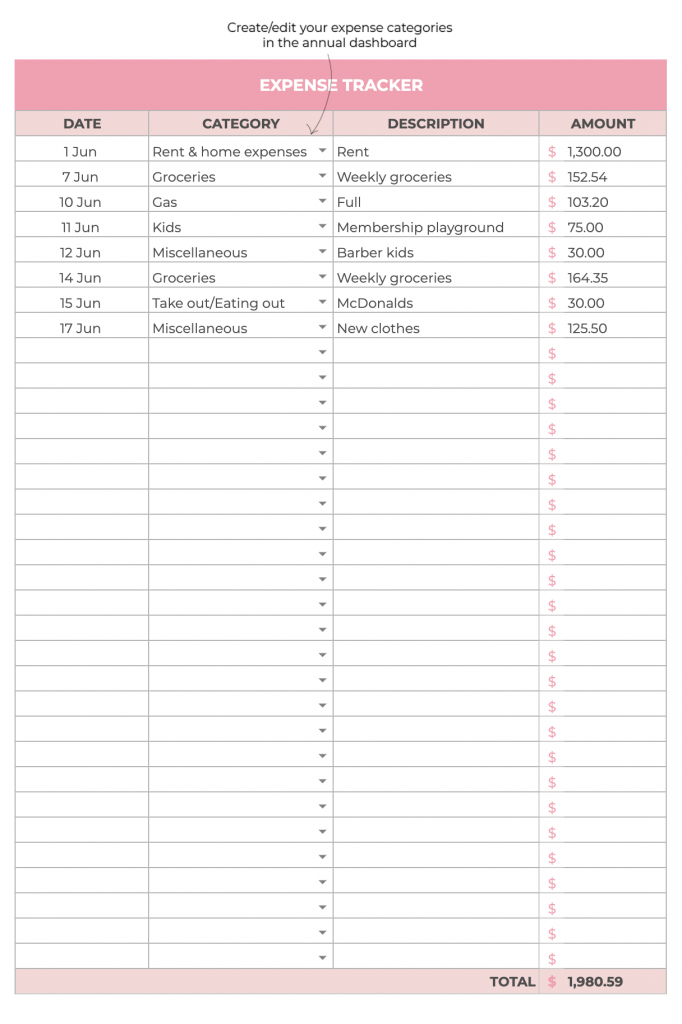
This tracker works similar to the income tracker. With this tracker you can track your expenses for the month. To select the date of your expense you can double click the cell to get the date picker (same as with the income tracker). Click the dropdown on the next cell to select your expense category. You can create or edit your expense categories in the yearly dashboard.
After that, you can add the description of your expense to the third column and you can enter the amount in the last one of the expense tracker. Once you have edited the cells the graphs at the bottom and the budget summary will automatically be updated. You’ll also see the total of your expenses at the end of the expense tracker.
The next section we’re going to discuss is the bill tracker
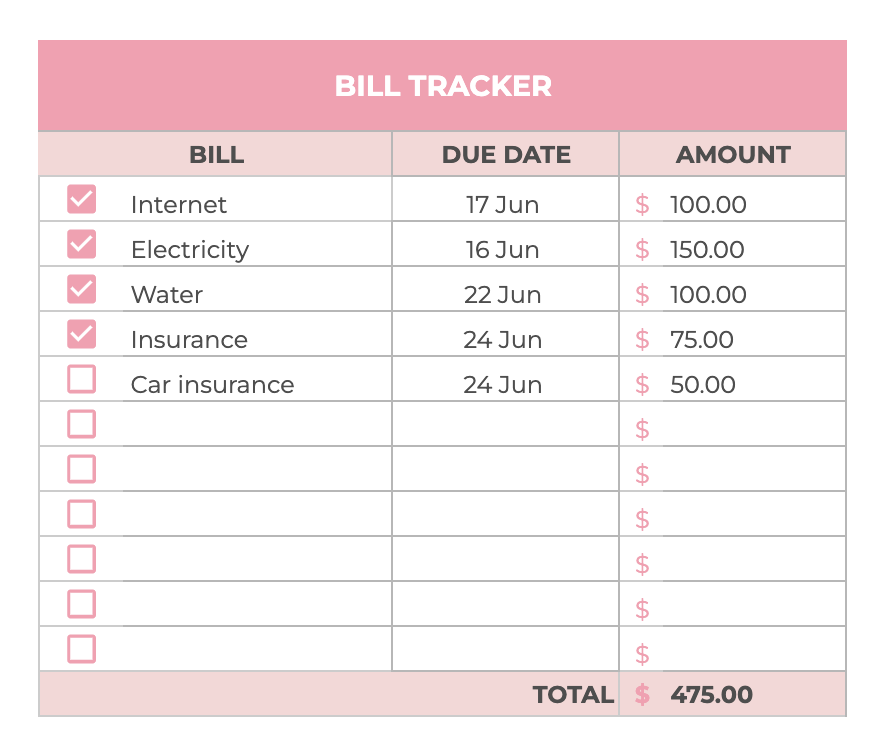
With this tracker you can track your bills for the month. You can enter the description, due date, and the amount for each of the bills and you can check it off once you have paid it.
Below the bill tracker you’ll find your savings and debt payments tracker.
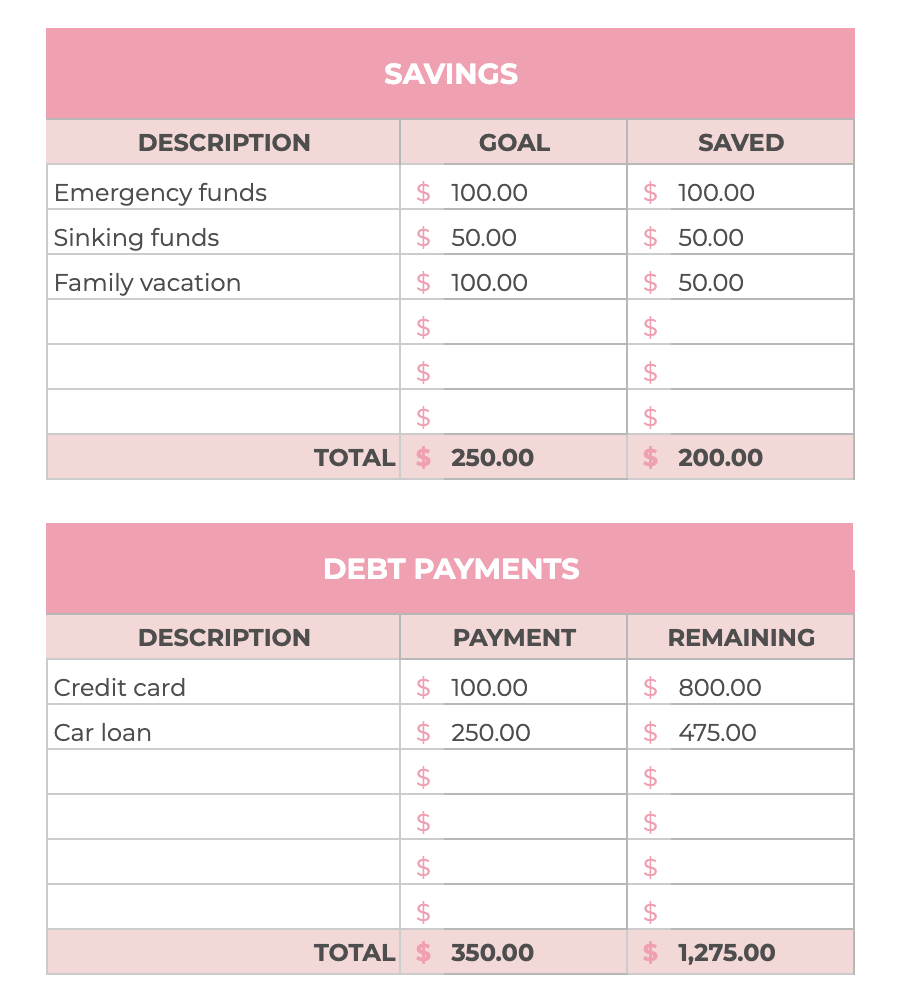
These are used to track your savings and debt payments and they’ll hopefully motivate you to save money throughout the month and to pay off your debts.
When you scroll to the left of the monthly budget sheet, you’ll see the expense budget summary.
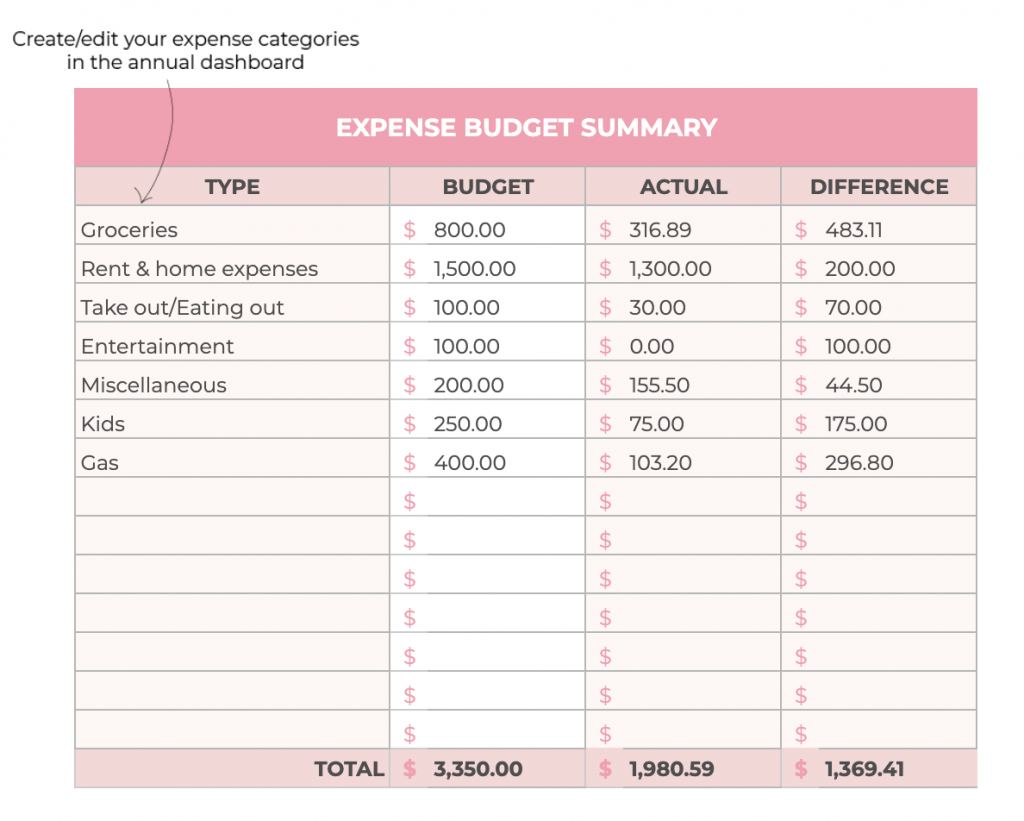
All you have to do here is set up your budget for each one of the expense categories. So for example with the groceries you can enter the maximum amount of money you want to spend on them for the month. In the column labeled “actual” you’ll see the actual amount you have spent on the groceries and this amount is based on the data you have entered in the expense tracker. The last column of the expense budget summary will show you the difference between your budget and the actual money you have spent. So with this summary you’ll be able to see whether you have stayed within your budget or not.
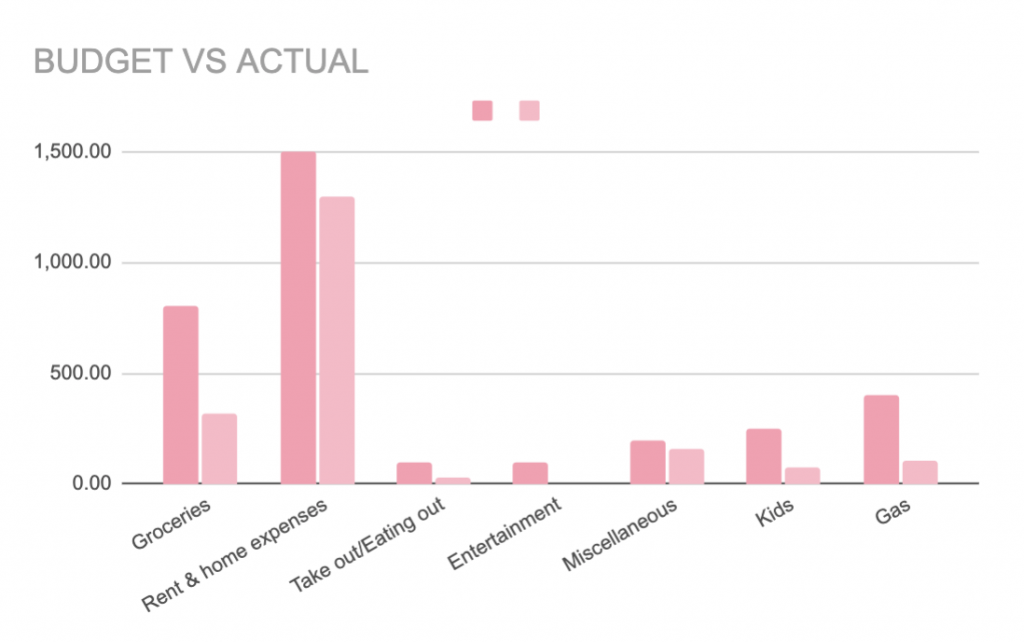
If you like visuals better, you’ll see the same stats on the bottom of the sheet. You can see a graph that tracks your budget vs the actual amount you spent for each category at a glance.
That’s all there is when it comes to the monthly budget tracker. As you can see, it’s a comprehensive budget tracker that’s easy to use at the same time. Hopefully, it’ll be helpful for you!
You can purchase the monthly budget tracker here:
https://waytoplan.com/planners/simple-budget-spreadsheet-google-sheets-monthly/
If you have any questions, don’t hesitate to leave a comment or reach out to us on Etsy.